|
|
Analysis of the
Coma Cluster |
|
|||||
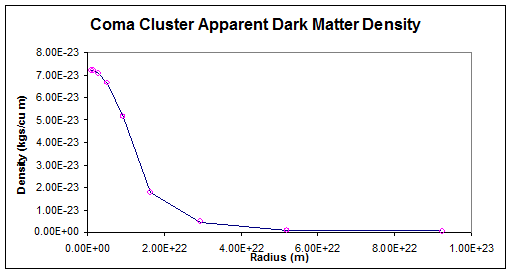
The Coma Cluster is a large local galaxy cluster. For this analysis published data relating to the
apparent amount of dark matter in the Coma Cluster was collected. This was interpreted using the AGM Theory
to calculate the density profile of anti-gravity matter around and within the
cluster. The resulting profile is
consistent with the concept of a weak anti-gravity matter vortex. |
|
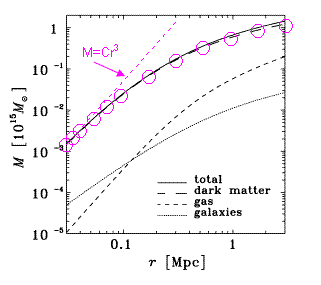
The graph
to the right is Figure 8 (upper panel) of source. In this graph M is the mass within a sphere
of radius r (unlike for the Analysis
of Abell 1689 in which a similar
looking graph shows projected mass).
Note that at low radius the apparent mass of dark matter is
approaching being proportional to radius cubed. That implies that at low radius the
apparent density of dark matter does not vary much with radius. Data was
scaled off the line on this graph for dark matter at the points marked with a
circle. From this were calculated the
apparent average density of dark matter within a sphere defined by the first
radius data point and within a series of concentric shells between the other
radius data points. |
|
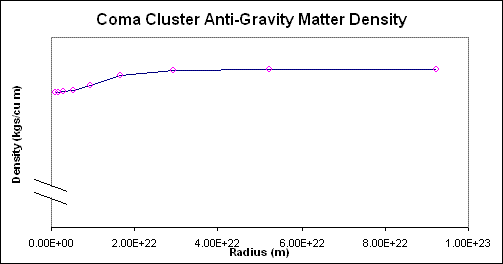
However
according to the AGM Theory there is no dark matter. The gravitational lensing is caused by an
absence of anti-gravity matter rather than by a presence of dark matter. That is,
there is a background density of anti-gravity matter throughout the
universe. The galaxies in the Coma
Cluster are orbiting each other and as they do so they drive an anti-gravity
matter vortex (or many vortices). The
anti-gravity matter vortex throws anti-gravity matter outwards and causes a
reduction in the density of anti-gravity matter within the cluster. This generates a gravitational attraction
to the centre of the cluster for normal matter objects, anti-gravity matter
particles and light. |
|
Conclusion The shape
of the anti-gravity matter density profile, particularly the flattening at
low radius is consistent with an anti-gravity matter vortex. The Coma Cluster vortex is rather weak
compared to that of Abell 1689. |
© Copyright Tim E Simmons 2010 to 2015.
Last updated 21st May 2015.
Major changes are logged in AGM Change Log.