|
|
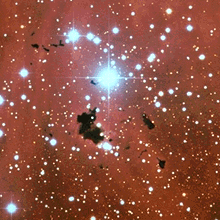
Analysis of Bok
Globules |
|
||||
|
This
analysis is part of a sequence of logical steps that are described in Investigation.
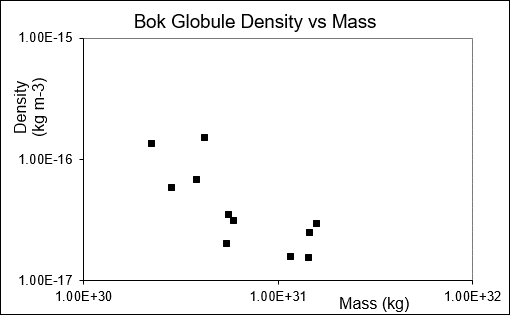
Data relating to several Bok Globules have been
published in Source. This includes an estimate of the mass of
the Bok globules measured by absorption of radiation from background
stars. Data extracted from that
publication are shown in the table below along with a calculation of the
radius and average density of the Bok globules. Angular radius is taken from
Table 4 of that publication. Other
data are taken from the second lines of Table 5.
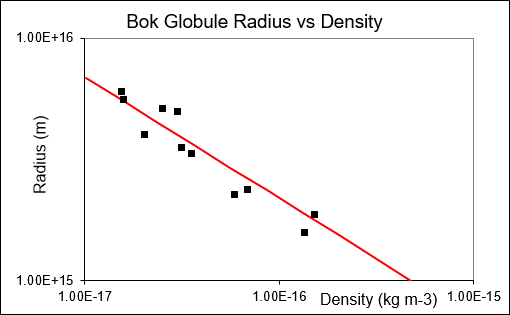
Graphs of Bok globule density against mass and Bok globule
radius against average density is shown below. More massive Bok Globules are on average
less dense. The correlation
coefficient for log(Radius) against log(Density) is -0.951. The probability of such a correlation
occuring by chance is less than 0.0001.
The solid
red line is a prediction from the AGM Pressure Simulation of how the AGM
Exclusion Density and the radius of the AGM Boundary vary as the mass of a
normal matter object varies. This is
referred to as the Dnx Line. It should
be noted that varying the values of the simulation parameters Gna, Gaa, Dab and Pab causes
the Dnx Line to move on the graph.
This has been done to make the line pass through the Bok globule
points. However varying those values
will not change the gradient of the line.
The gradient has a value of approximately -0.5 on this log/log
graph. This is explained in Investigation.
The radius
data points that derive the Dnx line are based on the R1 definition of the
AGM Boundary as described in AGM Pressure Simulation. |
© Copyright Tim E Simmons 2009 to 2016.
Last updated 11th August 2016.
Major changes are logged in AGM Change Log.