|
|
Analysis of
Globular Clusters |
|
|||||
|
This analysis
is based on data on 151 globular clusters that is published at Source Globular
clusters are dense collections of stars usually orbiting within a
galaxy. Omega Centauri is the largest
local example of a globular cluster.
Most of the Milky Way’s globular clusters are orbiting outside the
galaxy disc. An explanation of the
existence of globular clusters according to the AGM Theory is set out in Behaviour. This explains that they are an example of
the AGM Excluded state. They are so
dense that the AGM Boundaries of most of the stars have combined. It also explains that globular clusters may
contain very old stars but they are relatively short lived objects. For this
analysis the mass of the globular clusters was estimated from their apparent
magnitude and their distance. To do this they were assumed to comprise of
only sun-like stars. As an example the
mass of the stars in Omega Centauri calculated this way is 1.57 × 1036 kgs (7.85 × 10⁵ sols). However
the mass of Omega Centauri quoted in many other sources (for example here) is about 1 × 1037 kgs (5 × 10⁶ sols). This
analysis continues on the assumption that the first figure is most accurate
estimate of normal matter mass. The radii,
volumes and densities of the clusters were then calculated. This allowed each cluster to be plotted as
a blue cross on the graph on the right.
These are shown in the context of the red Dnx
line and the Bok globule data as developed in Investigation.
Note that the density of a cluster is not necessarily the AGM
Exclusion Density. The cluster’s AGM
Boundary is somewhere within the cluster.
However this affects each cluster and the point does not detract from
the discussion below. It can be
seen that most globular clusters are well above the density that would be
predicted from a simple comparison with the red Dnx
line. Most clusters fit into a fairly
tight group on the graph but there are several clusters scattered outside the
group at lower densities and/or lower radii.
There appears to be a cut-off marked by the dotted blue line above
which there are no clusters. The
cut-off is quite close to where the clusters are most tightly grouped. It also appears to be approximately
parallel to the lower part of the red Dnx Line. |
|
Any cluster
that happened to be above the blue dotted line would be too dense to be in
contact with the anti-gravity matter around it. Its outer envelope would relatively quickly
expand as higher energy stars escape until it makes contact with the
anti-gravity matter, making first contact at the leading face. This expansion would move it on the graph
above in the direction of arrow (1).
Having made contact with the anti-gravity matter its radius would
stabilize except that over time it will lose stars and mass to the
anti-gravity matter wind. It would
follow arrow (2) parallel to the blue dotted line. Eventually clusters are broken up by the
anti-gravity matter wind and lose their identity. Their average density drops below the AGM
Exclusion density and the AGM Boundaries of their stars separate. |
|
Density
Factor is proportional to an object’s displacement perpendicular to the lower
sloping part of the Dnx line as shown on the
right. |
|
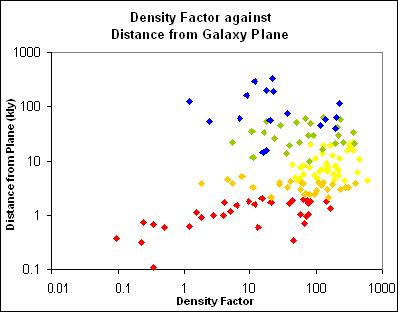
The
globular clusters that are within about 40 kly of
the galaxy centre (the red, orange and yellow ones) show a relationship
between density factor and distance from the galaxy plane. Most such clusters close to the galaxy
plane have a low Density Factor and all such clusters further away from the
galaxy plane have a higher Density Factor.
According to the AGM Theory this is because close to the galaxy plane
the anti-gravity matter is orbiting as well.
As a result for clusters which are orbiting in the galaxy plane their
speed relative to the anti-gravity matter is reduced. Away from the plane the anti-gravity matter
is moving relatively slowly (relative to the galaxy centre). Those clusters feel the full force of the
anti-gravity matter wind caused by their own orbital speed. The clusters
that are away from the galaxy plane do not stay away from the galaxy plane
all the time. Their orbit is at a
steep angle to the galaxy plane so they pass through it twice per orbit. This accounts for the small group of red
clusters that have high Density Factor.
They are passing through the galaxy plane quickly whereas the red
clusters with low Density Factor stay close to the galaxy plane all the time. |
|
Further
investigation is set out in Analysis of Globular Cluster Colour. |
© Copyright Tim E Simmons 2009 to 2016.
Last updated 10th August 2016.
Major changes are logged in AGM Change Log.